The map below details crimes reported in Wandsworth between 10 and 17 June 2010.

If you have any information on any of these crimes you can get in touch with the local police on 020 7350 1122 or via Crimestoppers (anonymously, if you wish) on 0800 555 111, you may be eligible for a reward if your information leads to an arrest.

You can click on the individual markers for more information.


View Wandsworth Crime Briefing for 10 – 17 June 2010 in a larger map

In an emergency you should always call 999, but don’t forget that in non-emergency cases you can call the police on 0300 123 1212 or report crime via online.met.police.uk

  1. Yellow flags represent burglaries and red flags represent street crime.
  2. The briefing only contains details of burglaries and robberies. Other crimes are not included.
  3. You can see more detail by following the link to the Google website.
  4. The flags are not placed precisely (it would be irresponsible to advertise victims of burglary) but instead are spaced roughly equally on the roads they took place. The idea is to give a visual representation of the spread and range of crime in Wandsworth, rather than pinpointing crime locations.
  5. While I try to ensure the data is accurate it is reliant on the information I receive, and I’m only human, so it may be mistakes have crept in. Please let me know if you think you’ve spotted one.

James Brokenshire, the minister for crime prevention, visited Wandsworth today as part of Neighbourhood Watch week to see one of our training sessions in action.

I like to think that Wandsworth was ‘doing’ Big Society long before it became a part of Conservative and government policy. Our commitment to Neighbourhood Watch has been more than just putting up signs; we offer support to get them started, ongoing help and advice once running, central and localised messaging services to keep everyone informed and training sessions to help prepare co-ordinators so they can help in the event of an emergency (from floods and ‘flu, through to terrorism) and are better equipped to look out for and after their neighbours.

And at the risk of being boastful I believe the small team of dedicated staff in in the council’s community safety unit, with the help of partners in the police and fire brigade, and, of course, all the people who are Watch members in Wandsworth have created the best Neighbourhood Watch system in the country.

It has played a key part in making Wandsworth the safest borough in inner London, but that doesn’t mean we should rest on our laurels. Strengthening and expanding Neighbourhood Watch was a key part of the local Conservative manifesto.

The challenge we have now set ourselves is to expand coverage so those who have not traditionally been part of watch schemes, council and social housing, transient populations and large private developments, are covered – while maintaining the high quality of support and training we offer – to ensure everyone has the same opportunity to play a role in making inner London’s safest borough safer still.

The map below details crimes reported in Wandsworth between 3 and 10 June 2010.

If you have any information on any of these crimes you can get in touch with the local police on 020 7350 1122 or via Crimestoppers (anonymously, if you wish) on 0800 555 111, you may be eligible for a reward if your information leads to an arrest.

You can click on the individual markers for more information.


View Wandsworth Crime Briefing for 27 May – 3 June 2010 in a larger map

In an emergency you should always call 999, but don’t forget that in non-emergency cases you can call the police on 0300 123 1212 or report crime via online.met.police.uk

  1. Yellow flags represent burglaries and red flags represent street crime.
  2. The briefing only contains details of burglaries and robberies. Other crimes are not included.
  3. You can see more detail by following the link to the Google website.
  4. The flags are not placed precisely (it would be irresponsible to advertise victims of burglary) but instead are spaced roughly equally on the roads they took place. The idea is to give a visual representation of the spread and range of crime in Wandsworth, rather than pinpointing crime locations.
  5. While I try to ensure the data is accurate it is reliant on the information I receive, and I’m only human, so it may be mistakes have crept in. Please let me know if you think you’ve spotted one.

The map below details crimes reported in Wandsworth between 27 May and 3 June 2010. Holding two weeks of data means it, inevitably, looks worse than usual.

If you have any information on any of these crimes you can get in touch with the local police on 020 7350 1122 or via Crimestoppers (anonymously, if you wish) on 0800 555 111.

You can click on the individual markers for more information.


View Wandsworth Crime Briefing for 27 May – 3 June 2010 in a larger map

  1. Yellow flags represent burglaries and red flags represent street crime.
  2. The briefing only contains details of burglaries and robberies. Other crimes are not included.
  3. You can see more detail by following the link to the Google website.
  4. The flags are not placed precisely (it would be irresponsible to advertise victims of burglary) but instead are spaced roughly equally on the roads they took place. The idea is to give a visual representation of the spread and range of crime in Wandsworth, rather than pinpointing crime locations.
  5. While I try to ensure the data is accurate it is reliant on the information I receive, and I’m only human, so it may be mistakes have crept in. Please let me know if you think you’ve spotted one.

The map below details crimes reported in Wandsworth between 13 – 27 May 2010. Holding two weeks of data means it, inevitably, looks worse than usual.

If you have any information on any of these crimes you can get in touch with the local police on 020 7350 1122 or via Crimestoppers (anonymously, if you wish) on 0800 555 111.

You can click on the individual markers for more information.


View Wandsworth Crime Briefing for 13 – 27 May 2010 in a larger map

  1. Yellow flags represent burglaries and red flags represent street crime.
  2. The briefing only contains details of burglaries and robberies. Other crimes are not included.
  3. You can see more detail by following the link to the Google website.
  4. The flags are not placed precisely (it would be irresponsible to advertise victims of burglary) but instead are spaced roughly equally on the roads they took place. The idea is to give a visual representation of the spread and range of crime in Wandsworth, rather than pinpointing crime locations.
  5. While I try to ensure the data is accurate it is reliant on the information I receive, and I’m only human, so it may be mistakes have crept in. Please let me know if you think you’ve spotted one.

I’m currently doing some work in a local authority elsewhere in the country, hopefully helping them improve their (already good) community safety function. Inevitably you draw comparisons with your own experiences and the quality of what you provide. Of course, it’s impossible to do, because each partnership has different needs and priorities – what might be important to the residents of a London borough like Wandsworth might not be important to the residents of a rural district or an urban unitary council.

But it did remind me of my visit to see Wandsworth’s Safer Citizen scheme in action during April. Because it was in an election period so I couldn’t really write about it; now, however, it’s something I want to flag up because it’s something of which Wandsworth should be really proud.

The Safer Citizen scheme is an extension of the Junior Citizen scheme, developed to give children in the borough’s special schools their own Junior Citizen that is adapted to their particular needs, so, for example, children with hearing problems are taught different to children with mobility problems to ensure they are getting the benefits of fire safety training.

We’re lucky to have excellent partners helping us. As always the local police were there along with the fire brigade and Leonard Cheshire (who host the scheme). On the day I visited the London Fire Commissioner, Ron Dobson, and the Chief Executive of Leonard Cheshire, Eric Prescott, were also there to see the scheme in action.

Both left incredibly enthused by what they saw, with Ron Dobson particularly keen for the knowledge and experience of what Wandsworth are doing to be spread to other parts of London. It is a scheme that ensures everyone benefits from our services by recognising that equality is not about equal treatment, but ensuring everyone has the opportunity to benefit equally; a distinction that is all too often lost.

The map below details crimes reported in Wandsworth between 6 – 13 May 2010.

If you have any information on any of these crimes you can get in touch with the local police on 020 7350 1122 or via Crimestoppers (anonymously, if you wish) on 0800 555 111.

You can click on the individual markers for more information.


View Wandsworth Crime Briefing for 6 – 13 May 2010 in a larger map

  1. Yellow flags represent burglaries and red flags represent street crime.
  2. The briefing only contains details of burglaries and robberies. Other crimes are not included.
  3. You can see more detail by following the link to the Google website.
  4. The flags are not placed precisely (it would be irresponsible to advertise victims of burglary) but instead are spaced roughly equally on the roads they took place. The idea is to give a visual representation of the spread and range of crime in Wandsworth, rather than pinpointing crime locations.
  5. While I try to ensure the data is accurate it is reliant on the information I receive, and I’m only human, so it may be mistakes have crept in. Please let me know if you think you’ve spotted one.

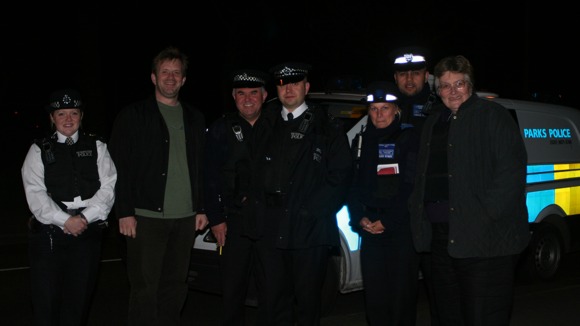
A blurry night-time photo of me with officers from the local SNT, Parks Police and council.

Round about now seventeen men should be up at South West Magistrates court for kerb-crawling (and other offences).

They were all arrested as part of an operation, jointly funded by Wandsworth Council, undertaken last month on Bedford Hill. I was invited along on one of the nights to see it in action.

The plan was fairly simple, female police officers would linger on Bedford Hill, wearing microphones. If anyone approached them for sex the evidence would be recorded and waiting officers would pounce to stop the kerb-crawler and arrest them. Many were also arrested for other offences, including one who was carrying a large knife when stopped.

It was a real demonstration of effective team work (as well as joint funding): the Metropolitan Police’s vice unit were running the operation, but were supported by the local Safer Neighbourhood Team and, once an arrest was made, the council’s Parks Police provided the transport to take the offender to the police station.

While I’m sensible enough to know that prostitution will never go away, I am also aware that we should ensure it doesn’t impact on other people’s lives in the way it does on Bedford Hill – causing local residents to feel unsafe and resulting in innocent women being propositioned by kerb-crawlers.

The map below details crimes reported in Wandsworth between 29 April – 6 May 2010.

If you have any information on any of these crimes you can get in touch with the local police on 020 7350 1122 or via Crimestoppers (anonymously, if you wish) on 0800 555 111.

You can click on the individual markers for more information.


View Wandsworth Crime Briefing for 29 April – 6 May 2010 in a larger map

  1. Yellow flags represent burglaries and red flags represent street crime.
  2. The briefing only contains details of burglaries and robberies. Other crimes are not included.
  3. You can see more detail by following the link to the Google website.
  4. The flags are not placed precisely (it would be irresponsible to advertise victims of burglary) but instead are spaced roughly equally on the roads they took place. The idea is to give a visual representation of the spread and range of crime in Wandsworth, rather than pinpointing crime locations.
  5. While I try to ensure the data is accurate it is reliant on the information I receive, and I’m only human, so it may be mistakes have crept in. Please let me know if you think you’ve spotted one.