
Is this an annual report? I don’t think so really, not by any stretch of the imagination but last year I posted on my attendance rate at Wandsworth Council meetings. I’m not sure how useful it was, personally, I think rating councillors according to town hall meetings is a poor indication of their effectiveness: would I be better going to 100% and achieving nothing, or just 25% of meetings and getting something out of them?
However, I record the data and I rather like playing with numbers. So, a breakdown of my 2011–2012 council year.
I’m including only some of the meetings I attend, basically the ‘public’ meetings. These represent only a fraction of the meetings I attend, but they form those which are part of the formal decision-making process or those I am appointed as a council representajtive.
Overall
 Overall I managed to attend 81% of meetings, missing nine out of 48. This is remarkably similar to last year, when I also managed an 81% attendance rate (missing eleven out of 58). The numerical decrease represents a change to a much less diverse portfolio, indeed, a number of the meetings at the beginning of the municipal year were ‘hang-overs’ from my old job. (One, the hate crime forum, still lingers, but more on that later.)
Council meetings
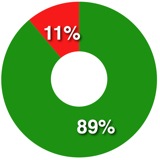
2011–2012: 89% attendance (eight out of nine meetings).
2010–2011: 90% attendance (nine out of ten meetings).
While these are at the top of the tree in the democratic process they are often rather stale affairs: at the end of the democratic process when most of the arguments have been had. Often I will not play any role in the meeting at all.
Executive
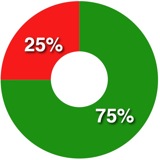
2011–2012: 75% attendance (six out of eight meetings).
2010–2011: 71% attendance (ten out of fourteen meetings).
I’m actually surprised this is that high. Executive meetings tend to be short, rubber-stamp meetings that are often timed in seconds; they are easy to miss.
Adult Care and Health OSC
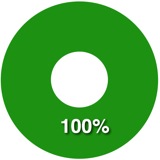
2011–2012: 100% attendance (one meeting).
2010–2011: 100% attendance (six meetings).
Nothing like a 100% record. But very easy when there’s only one meeting. This is one of those hangover meetings that I attended while my old role was dismantled.
Environment, Culture and Community Safety OSC
2011–2012: 100% attendance (three meetings).
2010–2011: 100% attendance (seven meetings).
This is an odd meeting since only a tiny part of my current role sits within the OSC’s remit (and arguably also sits within another committee’s remit too). I only attend when relevant items are on the agenda which doesn’t happen that often.
Hate Crime Forum
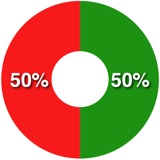
2011–2012: 50% attendance (two out of four meetings).
2010–2011: 100% attendance (three meetings).
This is a lingering meeting from my old council role. I’ve retained the chairmanship of this while it – hopefully – moves to a self-sustaining community-led format. My poor attendance was down to bad luck, with a nasty chest infection and a bout of bad ’flu coinciding with the meetings.
Health and Wellbeing Board
2011–2012: 100% attendance (four meetings).
2010–2011: 100% attendance (two meetings).
Again, a hangover meeting which I attended while my role was dismantled and a suitable replacement council representative found and formally nominated to the membership.
Nine Elms Strategy Board
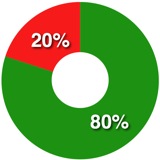
2011–2012: 80% attendance (four out of five meetings).
2010–2011: not a member.
A new meeting for this year. I missed one because it clashed with my holiday, which had already been booked before my appointment.
Shaftesbury Park Governors
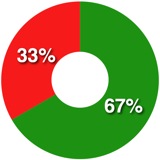
2011–2012: 67% attendance (two out of three meetings).
2010–2011: 0% attendance (none out of three meetings)
I had a shocker with this last year, every meeting clashing with something else. My diary was a lot better this year, I missed one meeting because of a clash, but was able to attend the other two.
South West London NHS Joint Boards
2011–2012: 50% attendance (one out of two meetings).
2010–2011: 100% attendance (two meetings).
Another one of those hangovers. I gave apologies to a formal meeting that was merely convened to ratify the accounts.
Strategic Planning and Transportation OSC
2011–2012: 100% attendance (five meetings).
2010–2011: did not have a relevant portfolio.
This committee’s remit covers the lion’s share of my current role.
Wandsworth Employment and Skills Partnership
2011–2012: 100% attendance (four meetings).
2010–2011: not a member.
Another new meeting.
Wandsworth Local Strategic Partnership
2011–2012: 100% attendance (one meeting).
2010–2011: 75% attendance (three out of four meetings).
An easy 100%, only one meeting to attend! I am still formally a member of this (I think) although it has not met for some time and I suspect will either be wound up or have a much different role in the future.
Wandsworth Police Consultative Committee
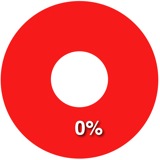
2011–2012: 0% attendance (missed one meeting).
2010–2011: 60% attendance (three out of five meetings).
Given that I got a few 100%s from single meetings, it’s only fair I should get a zero somewhere. Another hangover meeting, related to my old portfolio. It clashed with another meeting.
And in conclusion…
Do you have any better idea of what I do as a councillor? Or whether I’m any good at it?I’m guessing no. But what would help you answer those questions?
 Jan 2012")
 Jan 2012")
 Jan 2012")