
If you want to let them know about your views on local policing or find out what the priority crimes in the area (as well as get crime prevention advice from them) they will be in McDonald’s from noon until 4.00pm.
If you want to let them know about your views on local policing or find out what the priority crimes in the area (as well as get crime prevention advice from them) they will be in McDonald’s from noon until 4.00pm.
I used to be quite involved in Wandsworth Neighbourhood Watch in a strange, semi-detached, way as the cabinet member responsible for the council’s involvement in the scheme. Wandsworth Council is quite unusual in having taken on responsibility for running it from the police, and has traditionally had one of the strongest networks in the country. But that responsibility perhaps created meant focusing on the wood rather than the trees.
The council and police have recently highlighted a spate of burglaries in the ward, mainly in the roads between Lavender Hill and Clapham Common and while the police have done a lot to tackle that (fairly recently they made four arrests which combined accounted for a lot of the crime) they were also keen to see Neighbourhood Watches playing their part.
What struck me though, looking at a presentation they laid on, was how the north of the ward, the Shaftesbury Park Estate, had hardly any active Watches at all. I may have spent years being proud of the extensive Neighbourhood Watch network in Wandsworth, but had not noticed the decline on my front door.
It was a revelation for me. It’s been nearly three years since I had any responsibility, but even before, I’d never looked at the data mapped (which raises more thoughts on data visualisation that is for another time). Instead I’d focused on the overall number for the borough and the numbers per ward. Shaftesbury ward has always, and still does, fair well when compared to the rest of the borough and therefore never came to be a priority. Instead I focused on trying to innovate—by trying to create better networks and offering enhanced training—and work on those areas that were underrepresented—ward with high proportions of social housing have tended not to be involved.
The accepted wisdom has always been that there is a stronger sense of community in the Shaftesbury Park Estate and, therefore, an assumption that things like Neighbourhood Watch would thrive. This seems not to have been the case.
Naturally the lack of Neighbourhood Watch does not mean a lack of community, either on the Shaftesbury Park or elsewhere. It may well mean that community networks perform the same functions without the formal status. I do, however, think Neighbourhood Watch can act as a proxy measure for a sense of community, and while the correlation is not absolute there is a correlation.
I did wonder about how we could turn that around, but that is also something for another time: I have to practice what I preach, which means starting, or at least trying to start, a Watch in my own street, but as a council service and with the council elections imminent it raises all sorts of issues regarding purdah that make it inappropriate for me to do anything until June.
That does not, however, prevent others from starting, and if you are in Shaftesbury Ward I’m happy to offer whatever support I can (just get in touch). You can get further information from the council’s Community Safety pages and the national Our Watch website.
The Shaftesbury Ward Safer Neighbourhood Team meeting takes place tonight at 7pm in the Shaftesbury Club, 128, Lavender Hill.
I’m a fan of neighbourhood policing, but one of its weaknesses, I think, is that the public are not particularly empowered to hold the police to account. Part of this is in the weakness of the data provided.
To a degree this is not the fault of police (at least locally) since they are police or community support officers, not statisticians. They can hardly be expected to also give a robust analysis of crime data. The result is that members of the public tend to get a list of numbers at the meeting that are hard to make sense of and offer no real context.
I suspect the police may argue that mapping provides that accountability, but I’m not sure that in ordinary circumstances mapping enables people to get a feel for what is happening and the overall trends: in other words, are the police winning or losing?
Which prompted me to quickly play with the figures from the Met’s mapping website.
I’m not sure I established the answer.
My first attempt was to compare the figures for total offences in the ward over the past two years.
 Jan 2012")
This compares the only monthly ward data available, from February 2010 until January 2012. My thinking was that comparing year for year would reveal any seasonal trends and allow an easy comparison, the 2011/12 year should be lower if the police are succeeding in reducing crime.
However, the figures are relatively low (between 58 and 133 crimes per month) and there are all sorts of factors that can create peaks and troughs that skew the comparison.
My next try was a cumulative figure for the two years in question, in other words, the total crime since the start point (in this case February 2010 and February 2011).
 Jan 2012")
My thinking is that this helps make the graphs easier to read, because they don’t have the jumps, and makes it clearer that year on year performance is better or worse. However, I think it does make it a bit harder to see the comparative trend.
My final attempt at graphing performance was a running cumulative total, so the data point for each month contains the total crime for the preceding 12 months.
This has the major disadvantage that the Met only provide 24 months of data, so there is no ward data available before February 2010. The only older data is at borough level and the most recent provided is for the 2008/09 financial year. To see if it made sense I bodged something together from the London Datastore, which has crime rates by ward up to the 2009/2010 financial year. Far from perfect, but it means I can create data for February 2009 to January 2010 that isn’t too far wide of the mark.
 Jan 2012")
[NB My assumption here is that crime divides equally by month. The rate for 2009/10 was 90.4 crimes per 1,000 people, and the population estimate was 13,545. Meaning a total of 1,224 crimes or 102 a month. The rate for 2008/2009 was 93.6 crimes per 1,000, and the population estimate was 13,510. Meaning a total of 1,265 crimes or 105 a month.]
Imperfect data aside, I think I prefer this one. It does make crime look high, since a twelve month figure is plotted to a single month, however, it removes the sudden changes of monthly data, makes it clear that, overall crime is lower, but also retains a sense of trend, since the line moves up when crime increases compared to the same month from the previous year.
Would publishing these regularly help the ward panels hold their SNTs to account? I don’t know. Indeed, not being a statistician myself I don’t know how valid they are. However, as a resident, I feel I have a better idea of the general crime picture and trends in the ward because of them. What do you think?
A bit of lazy blogging. But going through various bits and pieces from last week it occurred to me that I didn’t post my speech from the Neighbourhood Watch conference I referred to in Tweeting not twitching in Wandsworth.
I don’t often write speeches – which probably shows through in my performances in the council chamber – but was pressured to put a bit more preparation into this! And having done it, I’ll be damned if my words of wisdom won’t be available for all on the internet (with the usual “check against delivery” caveat):
Hello and welcome everyone to the Battersea Park Pump House for this afternoon’s conference on the Big Society and Neighbourhood Watch.
I would like to start by thanking Wandsworth Community Safety Trust for funding this afternoon and to the Wandsworth Community Safety Team for organising it.
I’m particularly excited by this afternoon’s programme because I have long believed that Neighbourhood Watch can be the leading example of the Big Society, and, here in Wandsworth, our work has been proving just that.
However, while we can throw any number of buzz-words at Neighbourhood Watch: whether we think it’s the Big Society, an example of nudge, traditional community empowerment – and I think there are plenty of examples to illustrate each concept and far more besides – the key thing about Neighbourhood Watch is that it just works.
Continue reading
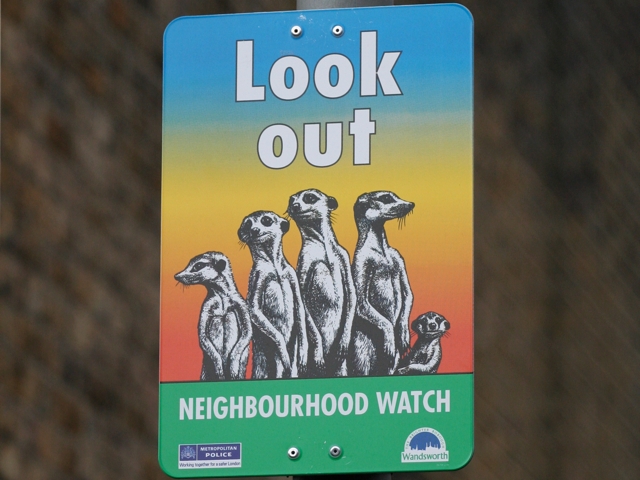
It’s received precious little coverage but we are coming towards the end of Neighbourhood Watch week. Most of the coverage there has been seems to have centred on the “tweeting not twitching” soundbite (probably more because of the reference to Twitter than Neighbourhood Watch), indeed, if you are listening to the radio this afternoon you might catch me doing a little spot on it.
I’m in a council limbo at the moment, between jobs (de facto, but not de jure until the council meeting formalises it next month) but it was pleasing to still, technically, be around for conference in Battersea Park the Wandsworth Community Safety Trust funded part of Neighbourhood Watch week, not least because it was the venue Baroness Browning, minister for crime reduction and anti-social behaviour, chose to formally launch the Our Watch website.
Neighbourhood Watch has never been a sexy topic. Perhaps it never will be. But I’m incredibly proud of what we’ve done in Wandsworth, where the council have been responsible for its management (it’s usually a police responsibility) since 1994.
I’m proud with good reason. Wandsworth has a disproportionate share of London’s Watches, of the 8,000 in London, 470 are in Wandsworth – and I’ve no doubt that plays a role in keeping Wandsworth inner London’s safest borough.
We are well ahead of the game on developing Neighbourhood Watch, recognising long ago that it’s about far more than curtain twitching and developing training schemes for members so in the event of disaster or terrorist attack they know what to do to help themselves, their neighbours and keep pressure off the emergency services.
And all this is recognised outside, so when London Fire Brigade were looking for a pilot area for a scheme in which volunteers are available to offer help and support to the victims of fire they chose Wandsworth purely because it had such a well-established base of Neighbourhood Watches that already went beyond the curtain-twitching stereotype.
If you want to find out more you might be interested in the council’s Neighbourhood Watch pages.
We’re currently going through our annual process of reassessing our community safety priorities, and as part of that consulting on what they should be and any issues you might have. Rather than re-write, the council’s text, and details of how you can take part, are below:
HELP MAKE WANDSWORTH A SAFER PLACE
Each year the Community Safety Partnership (the Council, Police, Fire Service, Probation and Primary Care Trust) reviews the priorities for reducing crime and disorder within Wandsworth. Following our analysis of crime and disorder within the borough, we now need to consult widely to confirm our understanding of what must be done. We therefore seek your views by completing a short questionnaire, the results of which will be used to determine our priorities for 2011/12.
This link will take you to the questionnaire which you can fill in online. You are invited to circulate the link as widely as possible to any individuals or groups within the borough that you are associated with who may be interested.
If you prefer, a printed copy of the survey can be provided; please telephone 0208 871 6603, stating your address and the number of copies required. When completed, the printed copy should be returned to:-
Director of Technical Services,
Community Safety Division,
Wandsworth Borough Council,
The Town Hall,
Wandsworth High Street,
London SW18 4BR.
The questionnaire can also be provided in large print if required.
Next week (from 18-24 October) is National Identity Fraud week. Wandsworth traditionally is one of the worst places in the country for identity theft, despite the problem gaining more and more exposure.
It only takes a few carelessly discarded items for your identity to be stolen, and it’s worth taking a few moments to make sure anything that can be used to prove your identity of residence is securely destroyed.
You can find out more about on the National Identity Fraud Prevention Week website.
Alternatively, because Wandsworth is such a hotspot next Wednesday (20 October) will see the council, local police are running a series of roadshows at:
As well as advice the sessions will also have shredders, ID protection stamps and security scissors.
The map below details crimes reported in Wandsworth between 5 – 12 August 2010, it features a total of 75 crimes (down five from the previous week).
If you have any information on any of these crimes you can get in touch with the local police on 020 7350 1122 or via Crimestoppers (anonymously, if you wish) on 0800 555 111, you may be eligible for a reward if your information leads to an arrest.
You can click on the individual markers for more information.
View Wandsworth Crime Briefing for 5 – 12 August 2010 in a larger map
In an emergency you should always call 999, but don’t forget that in non-emergency cases you can call the police on 0300 123 1212 or report crime via online.met.police.uk
The map below details crimes reported in Wandsworth between 29 July – 5 August 2010, it features a total of 80 crimes (down seven from the previous week).
There is a link between transport and crime, and what’s quite interesting about this map – whether coincidence or not – is how it appears to follow main roads.
If you have any information on any of these crimes you can get in touch with the local police on 020 7350 1122 or via Crimestoppers (anonymously, if you wish) on 0800 555 111, you may be eligible for a reward if your information leads to an arrest.
You can click on the individual markers for more information.
View Wandsworth Crime Briefing for 29 July – 5 August 2010 in a larger map
In an emergency you should always call 999, but don’t forget that in non-emergency cases you can call the police on 0300 123 1212 or report crime via online.met.police.uk
The map below details crimes reported in Wandsworth between 22-29 July 2010, it features a total of 87 crimes (up six from the previous week).
If you have any information on any of these crimes you can get in touch with the local police on 020 7350 1122 or via Crimestoppers (anonymously, if you wish) on 0800 555 111, you may be eligible for a reward if your information leads to an arrest.
You can click on the individual markers for more information.
View Wandsworth Crime Briefing for 22-29 July 2010 in a larger map
In an emergency you should always call 999, but don’t forget that in non-emergency cases you can call the police on 0300 123 1212 or report crime via online.met.police.uk