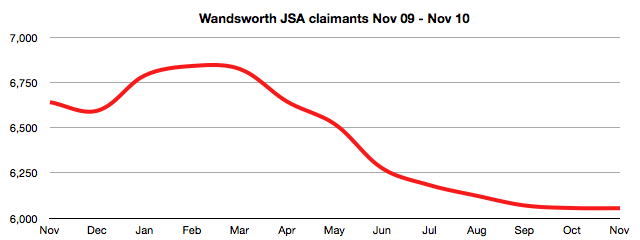
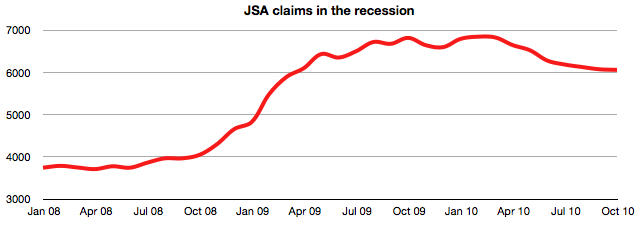
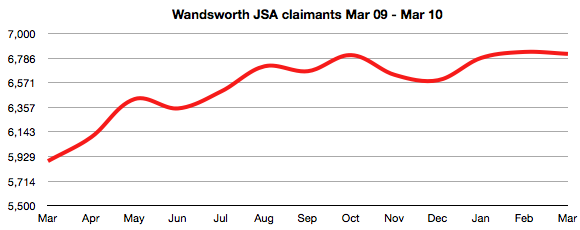
Almost no change in Jobseekers Allowance (JSA) claims in the borough for November! In October there were 6,056 claims, in November 6,055 (a change of just -0.02%). The year-on-year change is a little happier, it’s a drop of 586 (-8.82%) from this time in 2009.

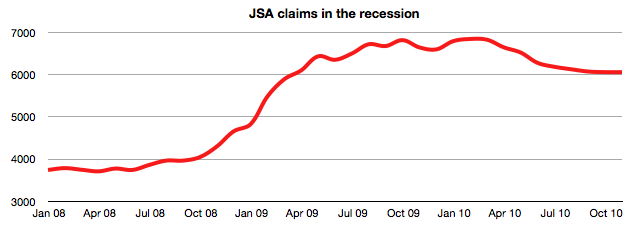
The longer term impact of the recession is clear, the graph of JSA claims since the recession started gives a clear picture of the long-term impact, a rapid increase as jobs were lost, but a slow recovery afterwards. And, of course, some of those jobs will never return: for example, many public sector jobs, unsustainably funded by massive borrowing are probably gone forever.

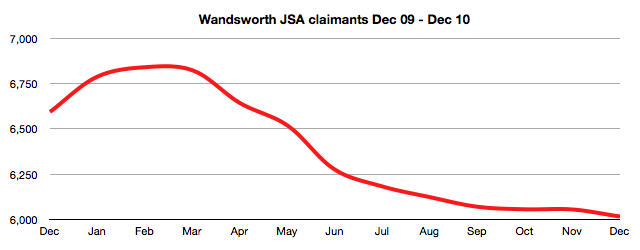
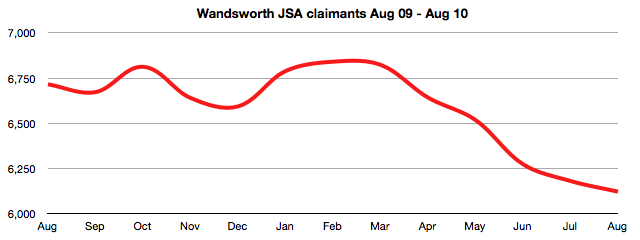
Another small drop in JSA claims in Wandsworth, and couldn’t be much smaller. Just 14 (0.23%) fewer claims than the previous month bring the total to 6,056. But still a decent drop over the course of a year, 757 (11.11%) fewer than this time in 2009.

During the week I heard a few people downplaying the impact of the recession, but I still think this graph tells a tale of the huge damage that the tale end of the Brown-Blair years unleashed.

With the eurozone in turmoil and the necessary effect of tackling the deficit still to come it might be some time before this is undone.

Wandsworth JSA claims: The slope is gentle, but in the right direction

I’m not sure how much value these posts add, but being anally retentive continue to produce them (and update the data).

September saw another slight fall in the total number of Jobseekers Allowance (JSA) claims, 53 (0.9%) fewer people were signing on than in August, bringing the total down to 6,070. The drop against this time last year was 603 people (9.0%)

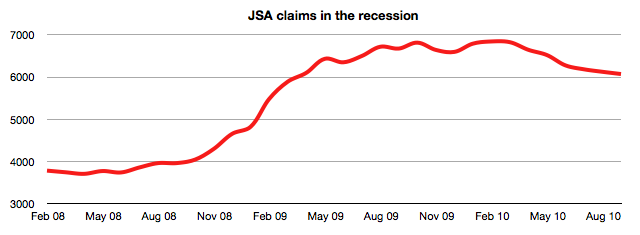
Still paying the price of recession: Claims are still significantly higher than their pre-recession low

The figures are not so bright when compared against the pre-recession low, when claims where under 4,000. At the moment claims are still 2,329 (50.0%) higher than pre-recession. Although it should be borne in mind that Wandsworth is still doing remarkably well compared to elsewhere, our claim rate is 2.8%, which compares favourably to rates of 4% and 3.5% for London and Great Britain respectively.


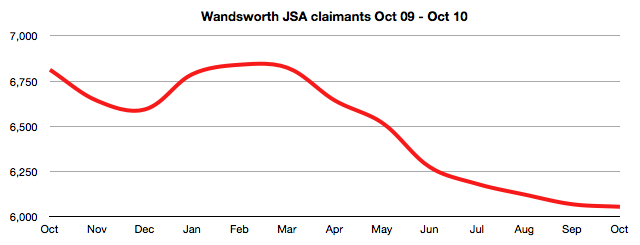
As I do every month a quick look at the Jobseekers Allowance claims in Wandsworth. Again, it’s seen a small drop. Nothing earth shattering, just 59 (1%) fewer than last month and 593 (8.8%) fewer over the year.

The trend seems healthy, if slow, although with speculation about double dip recessions and, of course, the impact of measures to tackle the deficit this might change.

What is telling is the graph over the course of the recession.

While the trend may be downwards now, there’s still a long way to go before it returns to anything like it was before the recession.

The data I’ve used to create the graphs (and come up with the figures) is on my data page.

I have been tracking, on here, the figures for Jobseekers Allowance (JSA) claims in Wandsworth for well over a year. May showed another small drop; 6,519 people claimed JSA, 124 (1.9%) fewer than the previous month, although still 89 (1.4%) more than the same time last year.

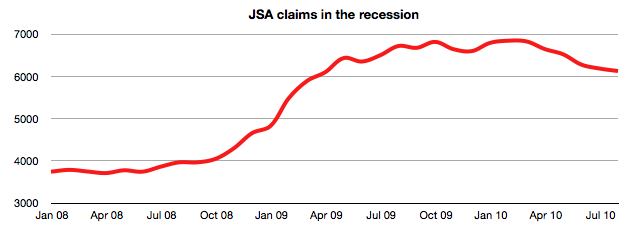
It does seem that the total claims have hit something of a plateau, something that becomes even more apparent if you look at the numbers of claims for the duration of the recession.

And it’s very difficult to guess what will happen next. There has long been speculation about a jobless recovery (in which businesses do not replace jobs that were lost during the recession) or a double dip recovery – neither of which bode well for the figures.

However, these threats have to be balanced by government plans to tackle unemployment which (and politically I would say this) I hope are likely to be more effective than the previous governments. To me, the recent announcement that to look at ways of helping people move to areas with more work (it’s the reason I left my home town to move to London) rather than forcing them to stay in an area of unemployment because they live in social housing. Other announcements – which I’ve yet to see condemned by the opposition – of creating a single welfare to work programme and funding providers on outcomes (like getting people into work) rather than the outputs (how many people they see) will hopefully start the transition from JSA and incapacity benefit being a transitional support while people get back in to the workplace rather than the permanent benefit they have become for all too many people.

It isn’t unemployment, of course, because those figures aren’t available for months on a borough level, but claims for Jobseekers’ Allowance, the main benefit available to the unemployed, fell (very slightly) in Wandsworth in March despite the national increase in unemployment.

Over the course of the year from March 2009 to March 2010 there were an extra 935 claims for JSA (a rise of 15.9%). The drop for the month was 17 (-0.2%).

Comparing claims over the course of the year is a little meaningless now, since the recession lasted so long the comparison is recession with marginally post-recession figures. Taking the figures over the course of the recession (from the beginning of 2008):

JSA claims have risen by 3,083 (or 82.4%) in this period.

What is interesting, at least in Wandsworth, is that the JSA claim figure seems to have plateaued since January. If you believe that the dip in November and December was seasonal (people taking on jobs for Christmas) you could argue that the plateau has lasted since October which fits in with the speculation that there will be a “jobless recovery” in which jobs lost in the recession won’t be recreated in the recovery.

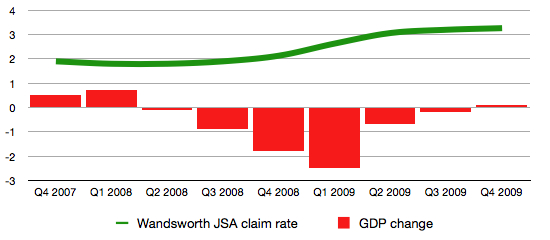
The UK has finally left recession. As Gordon Brown repeatedly told us, we were one of the best placed economies to weather the storm – although quite how that tallies with being the last major economy to see growth and having the longest recession since current records began escapes me.

What is interesting to me, is how Jobseekers Allowance claims in Wandsworth appear (and I stress appear) to have followed economic growth. Previously there has been a lag, with unemployment increasing after the recession has ended. JSA is only a proxy for unemployment (many people who are unemployed choose not to claim, or are ineligible) but its recent plateau seems to mirror the plateau in the economy. Whether this is coincidence, or a sign that the nature of recessions has changed, remains to be seen.

It’s not a dynamic end to the recession – only 0.1% growth in the provisional estimate – but a positive sign.

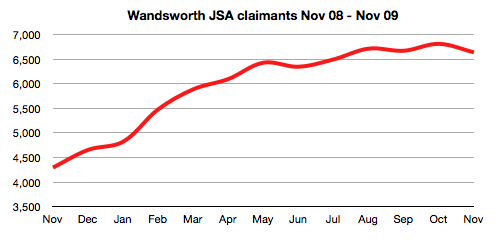
Earlier this week I did a little analysis on the number of Jobseekers Allowance claims in Wandsworth and pointed out that while claims seemed to have plateaued nationally the trend was still upwards in Wandsworth. This week saw a drop of 172 claims (or 2.5%) in Wandsworth that perhaps gives some hope we aren’t going to continue the rise.

Wandsworth JSA claims, Nov 08 - Nov 09

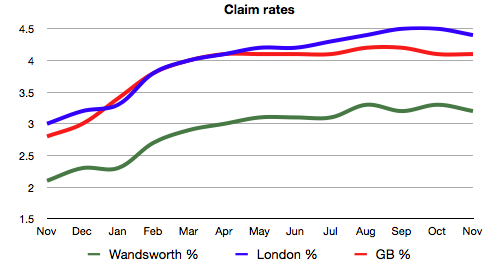
Claims are still up by 2,345 (or 54.6%) on this time last year. But the trend seems to be slowing (and maybe even reducing) and is holding up well against the London- and nation-wide rates.

JSA claim rates, Nov 08 - Nov 09

With the year drawing to a close, and hopefully the UK’s longest and deepest recession with it, I’ve spent a little time looking at how Wandsworth has coped.

I’ve repeatedly said that while Wandsworth isn’t immune to the effects of recession it is better placed than most to weather it.

The graphs below are various comparisons of Jobseekers Allowance claims. This isn’t a measure of unemployment (those figures aren’t produced for some months) since people can be unemployed without claiming JSA. And it isn’t the complete story; it ignores the take-up of other benefits and things like business failures or high street vacancies (Wandsworth has actually seen little change in these rates during the recession).

However, JSA can be a good indicator. So…

These graphs consider the period from January 2008 until October 2009, the represent (where appropriate) the highest rate in red, the lowest rate in green and Wandsworth in blue.

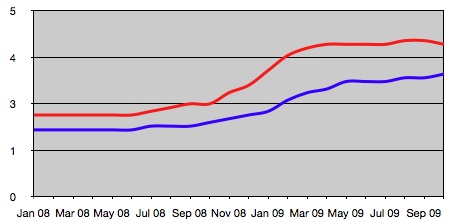
First up is a straight comparison between Wandsworth and the national rate of claims.

Wandsworth and national rate of JSA claims Jan 08 - Oct 09

A good story for Wandsworth. Overall the gap between the lines has increased. In January Wandsworth’s rate was 0.4% below the national rate, it’s now 0.8% – overall JSA claims have risen less here than nationally, there would be about 800 more people signing on if we’d followed the national trend.

However, the past few months seems to show the national figure on a plateau, while Wandsworth has still increased a little. This may be because people who have lost their jobs in Wandsworth (which has a high proportion of people working in the financial sector) have been living off their own means before signing on, but that is just conjecture, the figures will need watching for a few months to see if the trend continues.

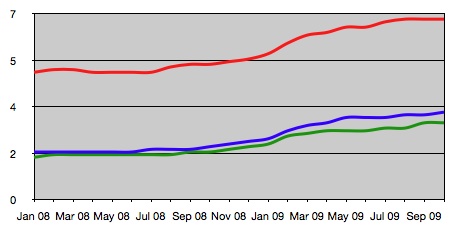
Next is a comparison between Wandsworth and the highest and lowest inner London borough rates.

Wandsworth and the highest and lowest inner London borough JSA claim rates - Jan 08 - Oct 09

Again, I think a good story. Wandsworth (the blue line) has the second lowest rate (Kensington and Chelsea, the green line). While our performance against them has deteroriated, we’ve seen the gap between us and the worst affected borough open from a 3% to a 3.5% difference so, proportionately, we’ve not been hit as hard as other inner London areas. And having the second lowest rate after Kensington and Chelsea is no cause for shame.

Finally, a comparison within the borough. This needs a slight caveat; the rates are calculated against smaller populations (the difference between thousands in a ward compared to 100,000 to 200,000 in most boroughs) so the rates can fluctuate more. However, over the period it shows a fairly clear pattern.
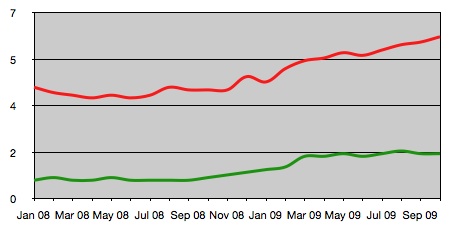
Wandsworth lowest and highest ward JSA rates Jan 08 - Oct 09

The story here is not so good. While we haven’t been as badly affected as some parts of the country those differences are reflected within Wandsworth. Ideally the rate of change would be the same, indicating a borough that is relatively cohesive. However, the gap between highest rate (Latchmere, in Battersea) and bottom (Thamesfield, in Putney) has widened from 3.5% to 4.4%. This is not an ideal situation and suggests some parts of the borough, because of poor transport links, access to employment opportunities or education and training are suffering more than than other parts. Exactly why things like the Employment and Skills Partnership are needed to target public resources to address those imbalances.

Overall, I think my repeated comment that Wandsworth has not been hit as hard as elsewhere has been true. And even Wandsworth’s worse wards haven’t been affected as badly as, say, Tower Hamlets or Hackney. But it does bring home that just performing better than elsewhere is rarely a cause for complacency.